Every monitoring system drifts away from the network it watches. A contractor racks a new access switch, a branch office swaps its router, and none of it lands in Zabbix or Checkmk because nobody filed the ticket. The monitor stays green, because it has no idea those machines exist. A fast, dumb question — “what actually answers on 10.20.30.0/24 right now?” — is the cheapest way to catch that drift, and Angry IP Scanner is one of the simplest tools for asking it.
Use with authorization only. Sweep only networks you own or administer under a written agreement, and tell your security team first. Even a polite ping sweep can trip intrusion detection and breach acceptable-use policies on networks that are not yours.
What Angry IP Scanner does
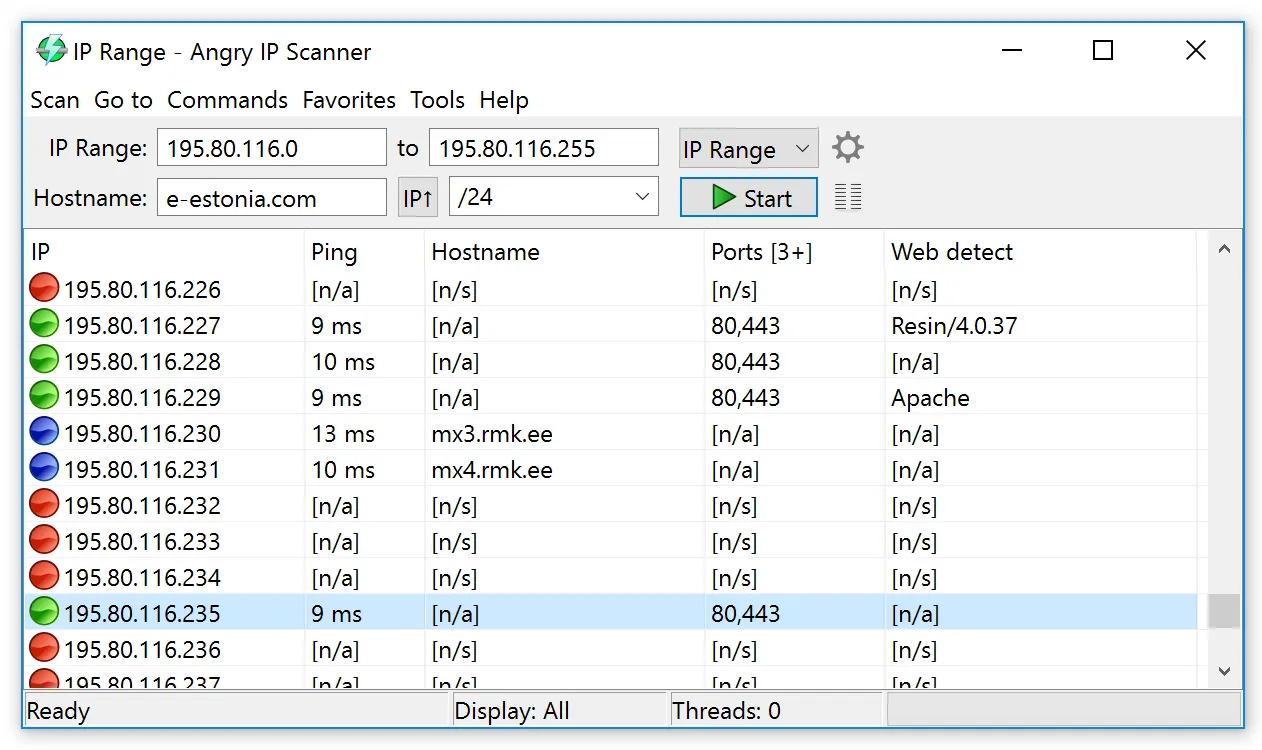
Angry IP Scanner is a cross-platform desktop application, written in Java and maintained by Anton Keks as an open-source project under GPLv2. You give it a target — an address range, a subnet with a netmask, or a text file of addresses — and it probes each one in parallel threads. For every address it reports whether the host appears alive, and it can fill in extra columns the project calls fetchers: hostname from reverse DNS, open TCP ports from a list you choose, MAC address and vendor on the local segment, NetBIOS details, and a basic web server detection.
Results land in a sortable table you can export to CSV, plain text, XML or an address-and-port list. User-defined “openers” launch a browser or SSH client against a selected host, and a plugin interface lets you write fetchers in Java. There is no server component, no database and no schedule: you start a scan, read the table, and close the window.
Where it earns a place next to your monitor
The most useful job for a monitoring admin is inventory reconciliation. Export the host list from your monitoring system, sweep the same ranges, and compare. Two lists fall out: addresses that answer but are not monitored, and monitored hosts that no longer answer. Both are worth a ticket. With a CSV from each side, the comparison is a one-liner:
# ips-monitored.txt: exported from Zabbix, Checkmk or LibreNMS
# ips-alive.txt: first column of the Angry IP Scanner CSV, alive hosts only
sort -u ips-monitored.txt > a; sort -u ips-alive.txt > b
comm -13 a b   # answering, but not in monitoring
comm -23 a b   # in monitoring, but not answering
The second job is seeding a new deployment. Before you point a fresh LibreNMS or Zabbix server at a network, a sweep with a sensible port list tells you what kind of hosts you are dealing with. Consider probing 22, 80, 443, 3389 and 5985 for general server types, 10050 for existing Zabbix agents, 6556 for Checkmk agents, and 9100 — which on a typical office subnet turns up printers as often as Prometheus node exporters. That tells you which templates, agents and credential sets you need before discovery rules start creating hosts.
It also makes a quick incident sanity check: when half a VLAN goes red at once, a sweep from your workstation shows whether the hosts are down or only the path from the poller is.
Where it falls short, and who should skip it
The biggest limitation for monitoring work is that port probing is TCP only. SNMP runs on UDP 161 and traps arrive on UDP 162, so a sweep cannot tell you whether a switch will answer your poller. For that, run snmpwalk from the poller itself, as our SNMPv3 setup guide describes, and capture the exchange with Wireshark if it times out.
It is also a point-in-time tool: nothing is stored, scheduled or alerted on. For “find new devices nightly and add them to monitoring”, the discovery rules in Zabbix, the network scan in Checkmk, neighbor discovery in LibreNMS or auto-discovery in PRTG do that job properly, with actions attached.
Hosts with ICMP filtered can look dead unless you switch to a TCP-based probe, and results across firewalls and VPNs vary. Being Java-based, some builds and platforms need a suitable Java runtime; check the project’s site for current requirements. Security teams needing service fingerprinting will find it too small.
Who it suits
Admins who own a monitoring system and want an independent, five-minute cross-check of what is really on the network — small teams, MSP technicians working on client networks with written permission, and anyone about to design discovery rules who wants to see the raw landscape first.
Licensing and cost
Angry IP Scanner is free and open source under the GNU GPLv2. There is no paid edition or subscription, and the public source lets you read how each fetcher works before running it on production networks.
How it compares
It sits in our network discovery and troubleshooting table alongside tools that answer different questions. Wireshark shows what happens on the wire; Angry IP Scanner shows what answers at all. Against built-in discovery, the trade is independence and speed versus automation: a monitor’s discovery adds hosts for you, while a sweep gives you a list to review first. If you are still choosing the monitoring platform itself, LibreNMS vs PRTG and Zabbix vs Checkmk compare how each handles discovery at scale.
Getting it safely
Get it only from angryip.org or the project’s official source repository linked from there. Your admin workstation is exactly the machine you do not want running a repackaged build from a look-alike site. Where the project publishes checksums or signatures for a release, verify them before first run; on macOS and Windows, check that the operating system reports a valid signature where one is provided. Our where-to-get page walks through hash and signature checks step by step.
FAQ
Can Angry IP Scanner check whether SNMP is working?
No. Its port probes are TCP, and SNMP uses UDP. Confirm SNMP with an snmpget or snmpwalk run from the poller, using the same credentials your monitor will use, and capture the traffic if you need to prove where it stops.
Can I schedule scans and feed results into Zabbix or Checkmk automatically?
Not natively. There is a command-line mode (see the project documentation for current options), but for recurring discovery the monitor’s own rules are the better tool.
Is it safe to run on a production network?
On a network you administer, a ping sweep with a short port list is light. Keep thread counts modest across WAN links and avoid full port ranges on fragile devices such as old printers or PLCs.
Why do some hosts show as dead when they are clearly up?
Usually ICMP is blocked by a host or network firewall. Switch the pinging method to a TCP-based probe in the preferences, or add a port you know is open, and rescan.