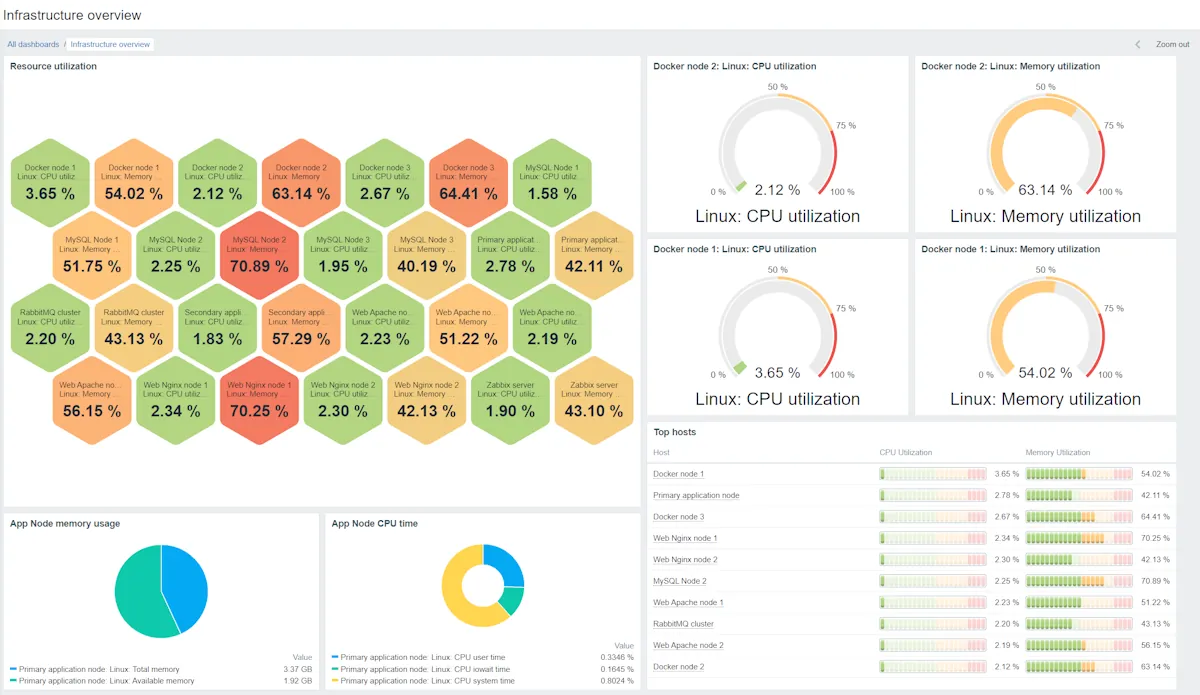
Picture a first Zabbix server deployed on a small VM with MySQL on the same disk, the stock Linux template linked to every host, and nobody revisiting the defaults. Six months later the history_uint table is larger than everything else on the box combined, the housekeeper runs for hours, and the web frontend crawls. It is a common story on admin forums, and it says something honest about the product: Zabbix is extremely capable, and it will not stop you from hurting yourself.
What Zabbix actually does
Zabbix is a server-and-agent monitoring platform. A central Zabbix server schedules checks, evaluates triggers and sends notifications; a relational database (MySQL/MariaDB or PostgreSQL, optionally with the TimescaleDB extension) stores configuration, history and trends; a PHP web frontend sits on top. Data arrives through several routes: the classic C agent or the newer Go-based Agent 2, SNMP v1/v2c/v3 polling and traps, IPMI, JMX, HTTP checks, SSH/Telnet scripts, ODBC queries and a growing set of HTTP-API integrations.
For anything beyond a single site you add Zabbix proxies, which collect data locally and forward it upstream. Proxies are what make Zabbix workable across branch offices and firewalled segments, and since 7.0 they can be grouped for automatic load balancing and failover.
The configuration model revolves around templates, items, triggers and low-level discovery (LLD). LLD is the feature that makes Zabbix scale: it finds filesystems, interfaces, containers or database instances on its own and stamps out items from prototypes.
Where it earns its keep
- Breadth without plugins. Out of the box, one product covers Linux and Windows hosts, network gear over SNMP, VMware, databases, web scenarios and cloud APIs. Few open-source tools cover that much ground without bolting on a separate time-series store.
- Preprocessing. JSONPath, regex, JavaScript and “discard unchanged with heartbeat” steps let you pull a single API response apart into dozens of items and throw away repeated values before they ever reach the database. Used well, this is the biggest lever on storage growth.
- Trigger logic. Expressions can combine functions across time windows, hysteresis is easy to express with separate recovery expressions, and trigger dependencies suppress the avalanche when an uplink drops. Our guide to cutting alert noise leans heavily on these.
- Long support windows. LTS releases get years of fixes, which suits teams that upgrade once and then leave it alone.
Where it falls short, and who should skip it
The database is your problem. History (raw values) and trends (hourly aggregates) are stored in SQL tables, and the built-in housekeeper deletes old rows in batches. On busy instances that deletion competes with inserts. The usual fixes are PostgreSQL with TimescaleDB and compression, or MySQL table partitioning with the housekeeper disabled for history. Both work, but both are things you have to know about before you need them. Our monitoring server sizing guide walks through the maths in terms of new values per second (NVPS).
Stock templates are generous to a fault. The official templates collect a lot at short intervals. On a 200-host estate that adds up fast. Expect to clone templates, stretch intervals, and disable discovery rules you do not care about.
Time to first useful dashboard is longer than it looks. Hosts appear with data within an hour, but a dashboard that an on-call engineer actually trusts takes days of trigger tuning, maintenance windows and user-group permissions.
The frontend is functional, not friendly. It has improved a lot in 6.x and 7.x, yet configuration still means many nested forms. Teams that want configuration-as-code end up scripting the API or using Ansible collections.
Skip Zabbix if you have a handful of servers and no appetite for DBA work, or if your stack is already cloud-native and Prometheus-shaped; you will fight the model more than use it.
Who it suits
Mixed estates of a few hundred to several thousand devices where one team owns servers, switches and some applications, and where somebody is comfortable running PostgreSQL. It also suits MSP-style setups where proxies sit in customer networks and report to a central server.
Licensing and cost
Zabbix is open source. Up to the 6.x series it was released under GPLv2; starting with Zabbix 7.0 the license changed to AGPLv3. For internal monitoring this changes nothing practical. If you modify Zabbix and offer it to others as a network service, read the AGPL obligations carefully. There is no license fee and no feature gating. Zabbix LLC sells support subscriptions, consulting, training and certification; tiers are sold by support level rather than by host count, so check the vendor’s current pricing if you want a contract behind you.
The real cost is hardware and time: a properly sized database server, fast storage, and the hours a person spends tuning.
How it compares
Against Checkmk, Zabbix gives you more raw flexibility but far less hand-holding; Checkmk’s automatic service discovery gets a useful view up faster. We cover this pairing in depth in Zabbix vs Checkmk. Compared with Icinga, Zabbix stores its own metrics and ships its own graphs, whereas Icinga expects you to add Graphite or InfluxDB. For network-first teams, LibreNMS auto-discovers switches with less effort. Commercial options such as PRTG trade the tuning work for a subscription. See the full field in open-source monitoring tools.
Getting it safely
Use the official package repositories at the Zabbix website: they provide signed packages for major Linux distributions, and the repository setup page generates the exact commands for your OS, version and database. Verify the repository GPG key before trusting it, prefer LTS branches for production, and never pull agent binaries from third-party mirrors. Our where to get monitoring software page lists the checks we run on every package.
FAQ
How much disk does a Zabbix database need?
It depends almost entirely on NVPS and retention. A rough rule is to estimate bytes per history row (around 90 bytes on MySQL including indexes) times values per day times retention days, then add trends. Measure after a week of real data and extrapolate rather than trusting any calculator.
Is Zabbix 7.0 still open source after the AGPL change?
Yes. AGPLv3 is an OSI-approved open-source license. The main difference from GPLv2 is that offering a modified version as a network service triggers source-sharing obligations.
Do I need proxies for a single site?
Not strictly, but a proxy still helps once you pass a few hundred hosts, because it buffers data during server maintenance and offloads polling.
Should I use PostgreSQL or MySQL?
Both are supported. We lean toward PostgreSQL with TimescaleDB for larger instances because compressed chunks make history retention cheap and drop old data without long delete jobs.