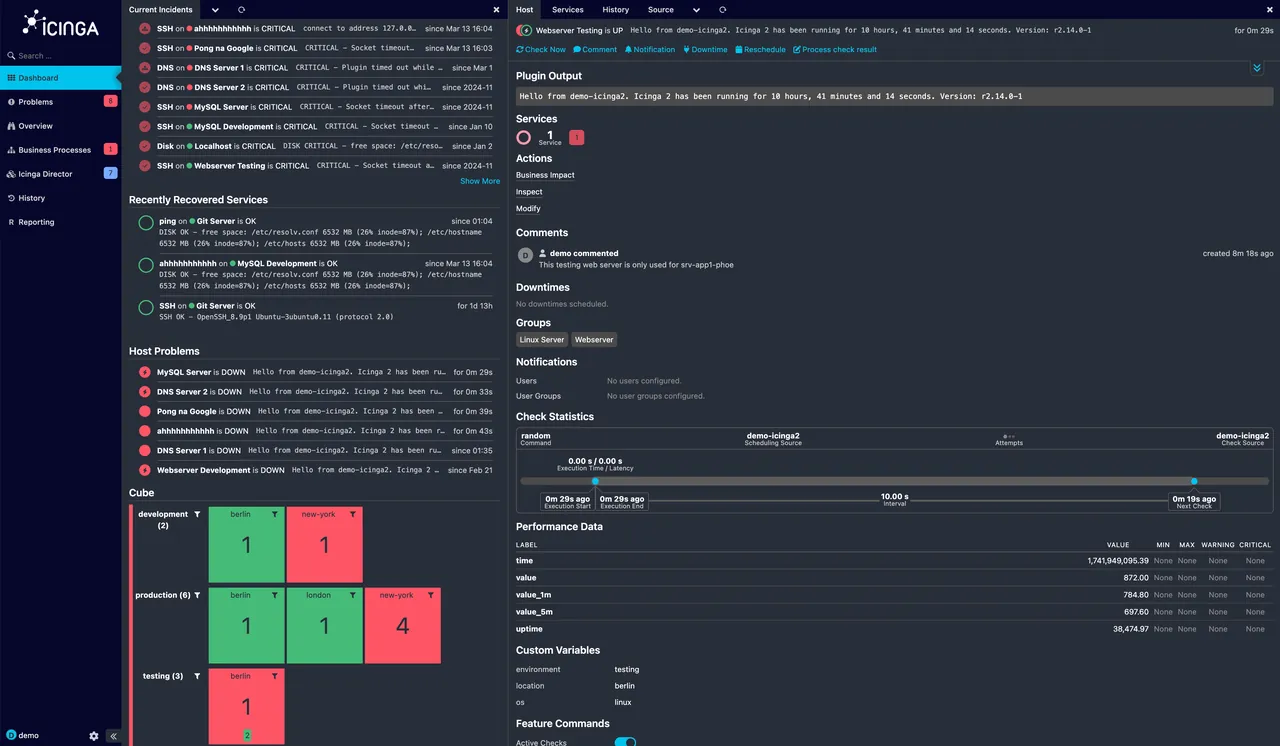
Picture forty new web servers that need to be monitored before lunch. On a Nagios box that means forty host definitions and a round of copy-paste. In Icinga 2 it can mean one apply Service "http" rule that matches a custom variable already set by a provisioning tool, a config validation, and a reload — and the servers show up with the right checks, the right notification rules and the right parent zone. That is Icinga’s pitch in one paragraph: rules instead of repetition.
What Icinga does
Icinga 2 is a C++ monitoring daemon that schedules checks, tracks state and sends notifications. It started life as a Nagios fork in 2009 and was rewritten from scratch for version 2. Around the core sits a small constellation of components:
- Icinga 2 itself, configured through its own DSL with objects, templates and
applyrules. - Icinga DB, a Redis-backed pipeline that feeds state and history into MySQL/MariaDB or PostgreSQL for the web UI. It replaced the older IDO backend, which is now deprecated.
- Icinga Web, the PHP interface with modules for business processes, reporting, certificate monitoring and more.
- Icinga Director, an optional web module for configuration, import sources and sync rules, for teams that prefer clicks or need to pull hosts from a CMDB.
- A built-in REST API for querying state, submitting passive results and creating objects at runtime.
Checks are the familiar Monitoring Plugins. Remote execution uses Icinga’s own agent over a TLS-authenticated cluster protocol, with a master / satellite / agent zone hierarchy.
Where it is strong
- Config as code. The DSL supports conditionals, loops over dictionaries and pattern matching. Combined with Git and CI validation (
icinga2 daemon -C), it gives reviewable, repeatable monitoring. - Distributed by design. Satellites run checks close to the targets and keep working if the link to the master drops, replaying results when it returns. High-availability master pairs are a supported configuration.
- Plugin compatibility. Anything you ran under Nagios keeps working, which makes migration far less risky.
- Integrations. Native writers exist for Graphite, InfluxDB, OpenTSDB and Elasticsearch-compatible stores, so metrics end up where your team already looks.
Where it falls short, and who should skip it
More parts than you expect. A production deployment typically means Icinga 2, Redis, Icinga DB, a SQL database, Icinga Web, the Director with its own database, and a metrics backend with Grafana. Each has its own package, service and upgrade notes. The first useful dashboard is realistically a few days away, not a few hours.
No metrics store of its own. Icinga records state history, not time-series metrics. If you want capacity graphs, you are running Graphite or InfluxDB too, and sizing that is a separate job.
Two ways to configure. Plain DSL files and the Director can coexist, but mixing them on the same objects is a reliable source of confusion. Pick one per object type and write it down.
Upgrade notes matter. Major transitions, such as moving from IDO to Icinga DB or reworking the Web 2 modules, needed planned work. Read the upgrade docs for every minor release.
Packages for some enterprise distributions are subscription-gated. Icinga’s public repositories cover Debian and Ubuntu, but packages for certain enterprise Linux families moved behind a subscription a few years ago. Check the repository page for your distribution before committing.
Skip Icinga if your team does not want to maintain text config or a multi-component stack, or if network devices are the bulk of what you monitor. Tools such as LibreNMS or Checkmk discover switch ports for you; in Icinga you write or import them.
Who it suits
Linux-heavy teams with configuration management already in place, estates spread across data centers or customer sites, and anyone migrating from Nagios who wants to keep plugins while gaining an API and clustering. It pairs well with an existing Grafana setup.
Licensing and cost
Icinga 2 is licensed under GPLv2, and the web components are open source as well. There is no license fee for the software. Icinga GmbH sells subscriptions that bundle support, access to packages for certain enterprise distributions, and some additional services; pricing is by subscription tier rather than per host, so check the vendor’s current pricing. Partners worldwide offer consulting and managed services.
How it compares
Against Nagios Core, Icinga adds a real API, apply rules and native clustering while keeping plugin compatibility; see Icinga vs Nagios and our Nagios migration guide. Against Zabbix, Icinga is leaner on storage but needs an external metrics backend. Checkmk gets you further faster through auto-discovery. Compare them all in server and service monitoring.
Getting it safely
Use the official Icinga package repository for your distribution, import and verify its signing key, and pin the repository so the web modules and core stay on compatible versions. Container images are published by the project; prefer those over unofficial builds. Our where to get monitoring software page covers key verification step by step.
FAQ
Is Icinga just Nagios with a new name?
Not since version 2. The core was rewritten in C++ with a new config language, API and cluster protocol. Only the plugin interface and some terminology carry over.
Do I need the Director?
No. It is optional and most useful when hosts come from an external source such as a CMDB or cloud inventory, or when non-Linux staff need to edit monitoring. Pure config-as-code teams often skip it.
Can Icinga run without an agent on each host?
Yes. You can check services remotely over SSH, SNMP or HTTP, or use passive results via the API. The agent is recommended for local checks such as disk and load.
How many checks can a single Icinga master handle?
Tens of thousands of services on reasonable hardware, especially when satellites carry the check load. Watch check latency and Redis memory as you grow.