Open almost any monitoring config written in the last two decades and you will find Nagios fingerprints: check_http, check_disk, exit code 2 for CRITICAL, the phrase “host group”. Plenty of admins keep a Nagios Core box around out of habit, and it remains one of the fastest ways to explain to a junior admin what a check actually is. It is a small, stubborn C program that runs plugins on a schedule, and it does that one job very reliably. Everything around that job is where the conversation gets longer.
What Nagios Core does
Nagios Core is a scheduler and state machine. You define hosts, services, contacts, time periods and commands in plain-text object files. The daemon runs a plugin for each service at its check_interval, reads the exit code (0 OK, 1 WARNING, 2 CRITICAL, 3 UNKNOWN) and the first line of output, and moves the service through soft and hard states before notifying anyone. Remote checks travel through add-ons: NRPE for executing plugins on Linux hosts, NCPA as the newer cross-platform agent, or passive results pushed in via NSCA or the external command file.
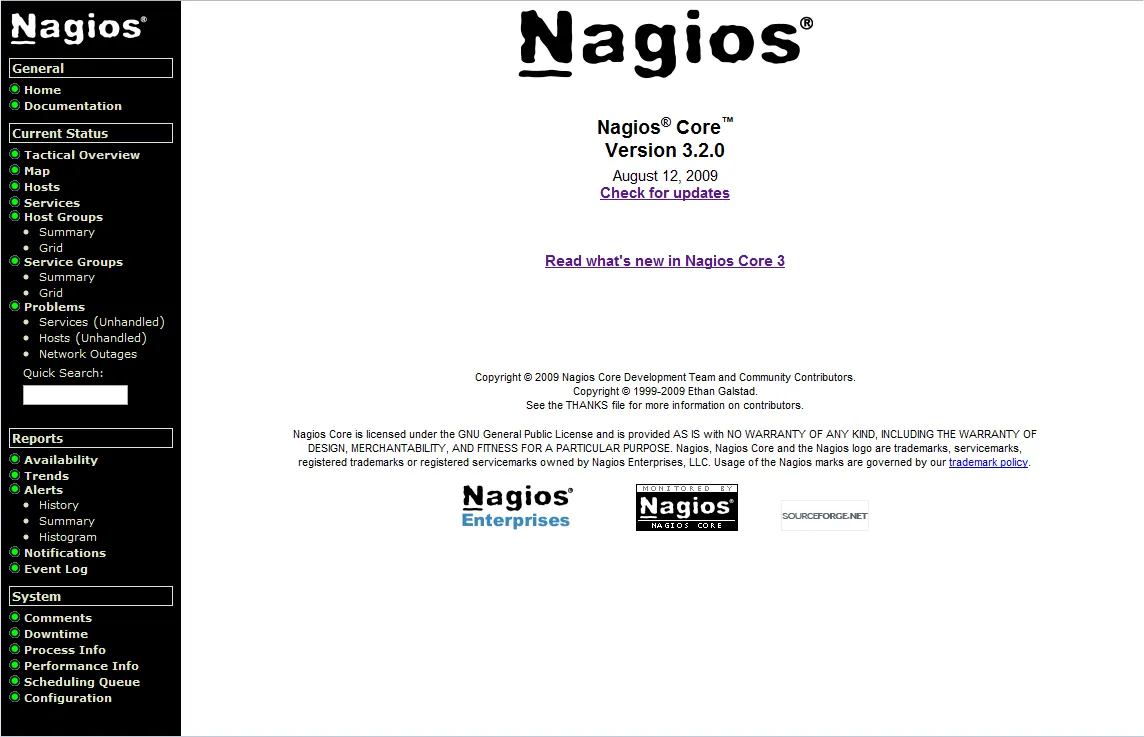
The bundled web interface is a set of CGI programs. It shows status, lets you acknowledge problems and schedule downtime, and not much else.
Where it is still strong
- The plugin contract. The plugin interface is so simple that thousands of checks exist for it, and the same plugins run unchanged under Icinga, Checkmk’s Raw edition, Naemon and others. Writing your own in Bash, Python or Go takes minutes.
- Predictability. Nagios does not auto-discover anything, so nothing appears or disappears unless you changed it. For regulated environments that want every monitored object reviewed, this is a feature.
- Tiny footprint. A few hundred hosts with a thousand-odd services run comfortably on a small VM. There is no database to size.
- Documentation and folklore. Almost every weird failure mode has been written about somewhere.
Where it falls short, and who should skip it
No metrics storage. Plugins can emit performance data, but Core does nothing with it. Graphs need PNP4Nagios, a Graphite pipeline or InfluxDB plus Grafana. That is a second system with its own upgrades.
Configuration sprawl. Object files with templates and inheritance scale, but only with discipline. Past a few hundred hosts, most teams generate config with Ansible, Puppet or scripts. A typo still stops the daemon from reloading, so run nagios -v in your pipeline every time.
Scheduling latency at scale. Every active check forks a process. With thousands of services at one-minute intervals, check latency climbs and the scheduler starts running behind. Mod_gearman and similar offloading tools help, at the cost of more moving parts.
The UI feels its age. The CGI interface has barely changed in years. There is no dashboard builder, no role-based config editing, and no API worth the name beyond the external command file and JSON CGIs.
Alert noise comes from you, not the tool. Flap detection and host/service dependencies exist, but you must declare every parent and dependency by hand. Forget them and a core switch failure pages you once per downstream service.
Skip Nagios Core if you want a dashboard by Friday, if nobody on the team enjoys text config, or if you need network device discovery. Teams starting fresh today usually get more from Icinga or Checkmk, both of which reuse the same plugins.
Who it suits
Small, stable estates where the service list changes rarely; environments already driven by config management; and anyone who wants a transparent check engine they can reason about line by line. It also remains a fine teaching tool.
Licensing and cost
Nagios Core is released under GPLv2 and carries no license fee. Nagios Enterprises also sells Nagios XI, a separate commercial product built around the Core engine with a web configuration wizard, reporting, dashboards and bundled graphing. XI is licensed by the number of monitored nodes, with Standard and Enterprise tiers; check the vendor’s current pricing for exact figures. Nagios Log Server and Nagios Network Analyzer are separate commercial products. Do not confuse the Core project with XI when reading comparison tables: they are different products with different licenses.
How it compares
Icinga began as a Nagios fork and became a full rewrite with a config DSL, a REST API and proper distributed zones; our Icinga vs Nagios comparison covers the migration trade-offs, and moving off Nagios Core is the step-by-step plan. Checkmk Raw uses the Nagios core under the hood but adds discovery and graphs. Zabbix is a different model altogether, with its own agents and database. See the whole field on open-source monitoring and server and service monitoring.
Getting it safely
Get Nagios Core source releases from the project site or its official GitHub organization, and compare the published checksum before building. Many distributions package Core and the Monitoring Plugins in their own signed repositories, which is usually the lower-maintenance route, though versions may lag. Avoid pre-built appliance images from unknown sources. Our where to get monitoring software page lists what to verify.
FAQ
Is Nagios Core still maintained?
Yes. Core 4.x continues to receive bug-fix and security releases, though feature development is slow and most new work goes into Nagios XI.
Can Nagios Core draw graphs?
Not by itself. It collects performance data from plugins and hands it off; you need an add-on such as PNP4Nagios or a Graphite or InfluxDB pipeline with Grafana for charts.
What is the difference between NRPE and NCPA?
NRPE is the older lightweight daemon that runs plugins on a remote host when the server asks. NCPA is a newer agent from Nagios Enterprises with an HTTPS API, built-in metrics and Windows support.
How many hosts can one Nagios server handle?
Hundreds comfortably, low thousands with tuning. Check latency is the metric to watch; when it grows past your interval, offload checks or switch to a scheduler built for scale.