A common line from IT leads at small, multi-site organizations goes something like: “I have two people, eleven sites and a CFO who wants one invoice.” That is the buyer OpManager is built for. Where the open-source tools on this site assume you will assemble the stack yourself, ManageEngine sells a single console with a long menu of optional modules, and evaluating it against a mix of switches, Windows and Linux servers and a small virtualization cluster is mostly an exercise in deciding which of those modules you actually need.
What OpManager does
OpManager is a commercial network and server monitoring platform from ManageEngine, the IT management division of Zoho Corporation. The core product discovers devices via SNMP, WMI, CLI and ping sweeps, classifies them using a large library of device templates, and monitors availability, interface traffic, CPU, memory, disk, services and processes. It also handles virtualization (VMware, Hyper-V, Nutanix and others), storage arrays, and hardware health via vendor MIBs.
The server runs on Windows or Linux and ships with a bundled PostgreSQL database, with Microsoft SQL Server supported for larger deployments. Larger or distributed editions add probes at remote sites that report to a central server.
ManageEngine sells a family of add-ons that plug into the same console: flow analysis (NetFlow Analyzer), network configuration management (NCM), firewall log analysis, IP address and switch port management, and application performance monitoring. OpManager Plus bundles many of these together.
Where it earns its keep
- Broad device templates. Thousands of templates mean most common switches, firewalls, printers and UPS units are classified correctly on discovery, with relevant monitors attached.
- Workflow automation. Built-in workflows can restart a service, run a script or collect diagnostics when an alarm fires, which cuts routine first-response work.
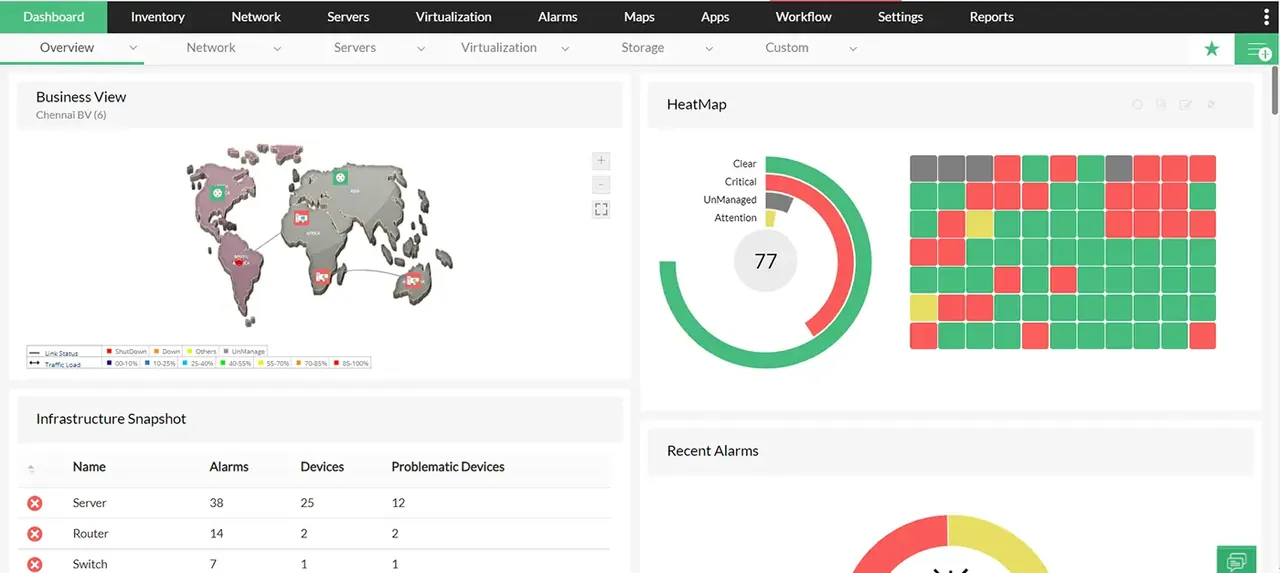
- One console for mixed estates. Network maps, server health and virtualization inventory live in the same interface, and role-based access lets you give site leads a limited view.
- Reasonable Linux support for the server itself. Unlike some Windows-only commercial suites, the OpManager server runs on Linux.
- Vendor support and documentation. Knowledge base articles are extensive and support is available by phone and ticket.
Where it falls short, and who should skip it
Add-on sprawl. The first quote often covers core monitoring only. Flow analysis, config backups and firewall logs each come as add-ons or a higher bundle. Map out which functions you need before comparing prices with competitors.
The bundled database needs attention. At a few hundred devices with many interfaces, the default PostgreSQL instance grows steadily. Review data retention settings for raw and aggregated data early, and plan storage accordingly. For large estates, ManageEngine’s own guidance points toward a dedicated database server.
Polling defaults are chatty. Discovery attaches many monitors per device with short intervals. As with any tool, trimming unused interfaces and monitors improves both performance and alert quality.
UI density. The interface covers a lot of ground and can feel crowded. Finding a setting sometimes means checking several admin screens.
Upgrade process. Upgrades are applied with service packs that must be run in sequence, and add-ons need compatible versions. Test on a staging copy for major jumps.
Skip OpManager if you prefer open standards and config-as-code, if you only need a small network view (open-source tools such as LibreNMS will do), or if you already run a mature Zabbix or Checkmk deployment and just need one more feature.
Who it suits
Small to mid-sized IT departments and multi-site organizations that want a single commercial product covering network, servers and virtualization, with vendor support and predictable per-device pricing. Teams already using other ManageEngine products such as ServiceDesk Plus benefit from the integrations.
Licensing and cost
OpManager is commercial software licensed per device, sold in editions such as Standard, Professional and Enterprise, with the Enterprise edition adding distributed probes and scale. Subscription and perpetual license options have both been offered; add-ons are priced separately or bundled in OpManager Plus. ManageEngine offers a time-limited trial. Exact figures vary by device count, edition and region, so check the vendor’s current pricing and request a quote for your mix.
How it compares
Against PRTG, the main difference is the unit of licensing: OpManager counts devices, PRTG counts sensors. A few hundred devices with many ports each often favors per-device licensing; a few very detailed devices can favor sensors. SolarWinds NPM targets larger network teams with deeper path and performance analysis. On the open-source side, Zabbix and Checkmk cover similar ground with no license fee but more setup work. See SNMP and network device monitoring and server and service monitoring for side-by-side tables.
Getting it safely
Go to the OpManager product pages on the ManageEngine website to request a trial or quote, and obtain the software only from there. Verify the published checksum and the digital signature on Windows before running anything, and restrict the web console to your management network. Our where to get monitoring software page explains these checks in more detail.
FAQ
Does OpManager run on Linux?
Yes. The server supports both Windows and Linux. Some add-ons and features have platform-specific notes, so check the compatibility matrix for the modules you plan to use.
What counts as a device for licensing?
Generally, any monitored node such as a switch, router, server or virtual machine host. Interfaces on a device are not licensed individually, but check how your edition counts virtual machines and storage.
Can OpManager analyze NetFlow?
Flow analysis is provided by the NetFlow Analyzer add-on, which integrates with the OpManager console, or through the OpManager Plus bundle.
How long does a typical deployment take?
Discovery and basic dashboards take a day. Tuning monitors, thresholds and notification profiles for a few hundred devices usually takes a couple of weeks of part-time work.